Regolamento (UE) 2021/1840

Regolamento (UE) 2021/1840
Regolamento (UE) 2021/1840 della Commissione del 20 ottobre 2021 che modifica il Regolamento (CE) n. 1418/2007 relativo all'esportazione di alcuni rifiuti destinati al recupe...
Global energy consumption in 2018 increased at nearly twice the average rate of growth since 2010, driven by a robust global economy and higher heating and cooling needs in some parts of the world. Demand for all fuels increased, led by natural gas, even as solar and wind posted double-digit growth. Higher electricity demand was responsible for over half of the growth in energy needs. Energy efficiency saw lacklustre improvement.
Energy-related CO2 emissions rose 1.7% to a historic high of 33.1 Gt CO2. While emissions from all fossil fuels increased, the power sector accounted for nearly two-thirds of emissions growth.
Coal use in power alone surpassed 10 Gt CO2, mostly in Asia. China, India, and the United States accounted for 85% of the net increase in emissions, while emissions declined for Germany, Japan, Mexico, France and the United Kingdom.
CO2 Emission
Driven by higher energy demand in 2018, global energy-related CO2 emissions rose 1.7% to a historic high of 33.1 Gt CO2. While emissions from all fossil fuels increased, the power sector accounted for nearly two-thirds of emissions growth. Coal use in power alone surpassed 10 Gt CO2, mostly in Asia. China, India, and the United States accounted for 85% of the net increase in emissions, while emissions declined for Germany, Japan, Mexico, France and the United Kingdom.
Global energy-related CO2 emissions grew 1.7% in 2018 to reach a historic high of 33.1 Gt CO2. It was the highest rate of growth since 2013, and 70% higher than the average increase since 2010. Last year's growth of 560 Mt was equivalent to the total emissions from international aviation.
The increase in emissions was driven by higher energy consumption resulting from a robust global economy, as well as from weather conditions in some parts of the world that led to increased energy demand for heating and cooling.
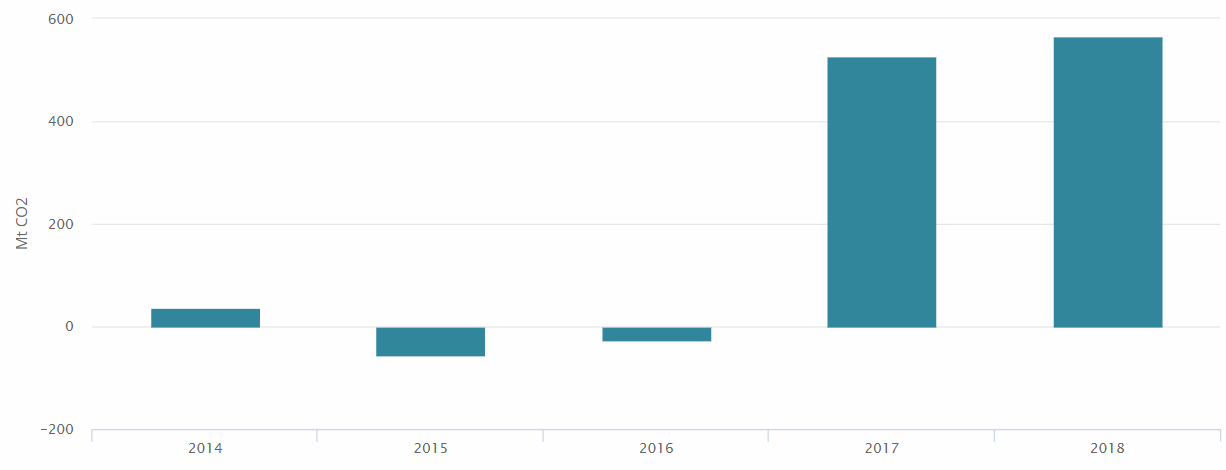
CO2 emissions stagnated between 2014 and 2016, even as the global economy continued to expand. This decoupling was primarily the result of strong energy efficiency improvements and low-carbon technology deployment, leading to a decline in coal demand. But the dynamics changed in 2017 and 2018. Higher economic growth was not met by higher energy productivity, lower-carbon options did not scale fast enough to meet the rise in demand.
The result was that CO2 emissions increased by nearly 0.5% for every 1% gain in global economic output compared with an increase of 0.3% on average since 2010. Renewables and nuclear energy have nonetheless made an impact, with emissions growing 25% slower than energy demand in 2018.
For the first time, the IEA assessed the impact of fossil fuel use on global temperature increases. It found that CO2 emitted from coal combustion was responsible for over 0.3°C of the 1°C increase in global average annual surface temperatures above pre-industrial levels. This makes coal the single largest source of global temperature increase.
The global average annual concentration of CO2 in the atmosphere averaged 407.4 ppm in 2018, up 2.4 ppm since 2017. This is a major increase from pre-industrial levels, which ranged between 180 and 280 ppm.
Trends by technology
In fact, coal-fired power plants were the single largest contributor to the growth in emissions observed in 2018, with an increase of 2.9%, or 280 Mt, compared with 2017 levels, exceeding 10 Gt for the first time.
As a result, coal-fired electricity generation accounted for 30% of global CO2 emissions. The majority of that generation is found today in Asia, where average plants are only 12 years old, decades younger than their average economic lifetime of around 40 years.
Despite growth in coal use, fuel switching between coal and gas accelerated in 2018, reducing the carbon intensity of global energy use. Driven by economics and policies, coal-to-gas switching avoided almost 60 Mt of coal demand, with the transition to less carbon-intensive natural gas helping avert 95 Mt of CO2 emissions. Without this coal-to-gas switch, the increase in emissions would have been more than 15% greater. This switch, most significant in China and the United States, reduced emissions by 45 Mt and 40 Mt, respectively.
Increased use of renewables in 2018 had an even greater impact on CO2 emissions, avoiding 215 Mt of emissions, the vast majority of which is due to the transition to renewables in the power sector.
The savings from renewables was led by China and Europe, together contributing two-thirds to the global total. Increased generation from nuclear power plants also reduced emissions, averting nearly 60 Mt of CO2 emissions. Overall, without the transition to low-carbon sources of energy in 2018, emissions growth would have been 50% higher.
Energy efficiency was the largest brake on emissions growth in 2018, but its contribution was around 40% lower than in 2017, largely because of a continued slowdown in implementing energy efficiency policies.
For the first time in almost a decade, 2018 saw an increase in plans to develop large-scale carbon capture, utilisation and storage (CCUS) facilities. By the end of 2018, the number of projects operating, under construction, or under serious consideration increased to 43. China is operating a new facility to capture CO2 from natural gas processing for use in enhanced oil recovery, and, in Europe, five new projects are under development.
The new facilities have the potential to capture up to 13 Mt CO2 annually, a 15% increase in potential CO2 capture across the global project pipeline. The expansion of tax credits for CO2 use and storage in the United States is also expected to support a new wave of investment in CCUS in the coming years.
Change in global CO2: emissions, 2014-18
Electricity generation from renewable sources increased by over 7% in 2018, injecting an additional 450 TWh into global electricity networks. Increasing output from nuclear contributed another 90 TWh of low-carbon generation.
Yet this increase was not fast enough to keep pace with the rapid growth in electricity demand, which required additional generation of over 1 000 TWh. The resulting increase in generation from fossil fuel-fired power plants saw the power sector account for almost two-thirds of the increase in total emissions. Without accompanying power sector decarbonisation, electrification does not necessarily mean lower emissions.
Despite continued growth in emissions, the power sector has seen significant transformation in recent years. Today the average carbon intensity of electricity generated is 475 gCO2/kWh, a 10% improvement on the intensity from 2010. Without this, global CO2emissions would have been 1.5 Gt higher, or 11% of current power sector emissions. An additional improvement in intensity of 10% would have been needed to avoid any increase in emissions from electricity generation since 2010.
In China, CO2 emissions grew by 2.5%, or 230 Mt, to 9.5 Gt. A jump of over 5% in electricity generation from coal-fired power stations drove up emissions by 250 Mt, which more than offset the impact of a decline in coal use outside of the power sector. An 80-Mt growth in emissions from gas combustion came predominantly from outside of the power sector, as gas was increasingly chosen as a substitute for coal-based heating.
In the United States, the emission reductions seen in 2017 were reversed, with an increase of 3.1% in CO2 emissions in 2018. Despite this increase, emissions in the United States remain around their 1990 levels, 14% and 800 Mt of CO2 below their peak in 2000. This is the largest absolute decline among all countries since 2000.
The impact of weather conditions was especially marked in the United States, driving up cooling and heating needs and accounting for about 60% of the emissions increase in 2018.
India saw emissions rise by 4.8%, or 105 Mt, with the growth split evenly between power and other sectors such as transport and industry. Despite this growth, per capita emissions in India remain low at only 40% of the global average.
Across Europe emissions fell by 1.3%, or 50 Mt. The emissions decline was driven by a drop of 4.5% in Germany, as both oil and coal combustion fell sharply. The drop in coal consumption was concentrated in the power sector, where generation from renewables reached a record high of 37% of the electricity mix. Electricity generation from renewables also saw a record year in the United Kingdom, accounting for 35% of generation, as the share of coal fell to 5%, a record low.
As a result, CO2 emissions in the United Kingdom declined for a sixth year, hitting some of the lowest levels recorded since 1888. France also saw a significant drop in emissions, as electricity generation from hydroelectric and nuclear power stations meant that coal and gas plants saw lower utilisation in 2018 than in 2017.
Emissions declined in Japan for a fifth year, with a decline across all fossil fuels largely due to both continued improvements in energy efficiency and the increase in generation from nuclear power stations as reactors came back online. In Mexico, emissions declined for the second consecutive year, after a three-year increase in emissions in the power sector was reversed last year.
...add more
IEA 2018
Collegati

Regolamento (UE) 2021/1840 della Commissione del 20 ottobre 2021 che modifica il Regolamento (CE) n. 1418/2007 relativo all'esportazione di alcuni rifiuti destinati al recupe...

Nota Stampa, 08.04.2019
Le attività di monitoraggio di ISPRA e ARPA Puglia
Le attività di monitoraggio di ISPRA e ARPA Puglia In relazione a quanto ac...

Approvazione del documento "Strategia Nazionale di Adattamento ai Cambiamenti C...
Testata editoriale iscritta al n. 22/2024 del registro periodici della cancelleria del Tribunale di Perugia in data 19.11.2024