Direttiva (UE) 2024/1203

Direttiva (UE) 2024/1203 / Reati e sanzioni tutela ambientale
ID 21782 | 30.04.2024
Direttiva (UE) 2024/1203 del Parlamento europeo e del Consiglio, dell’11 aprile 2024, sulla tutela penale dell’ambien...

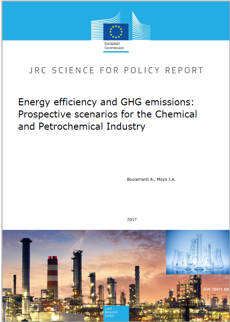
Energy efficiency and GHG emissions: Prospective scenarios for the Chemical and Petrochemical Industry
Maggio 2017, Commissione Europea, JRC
Questo studio analizza il potenziale risparmio del consumo energetico e le emissioni di gas serra miglioramenti tecnologici convenienti nell'industria chimica e petrolchimica fino a 2050.
L'analisi segue un approccio bottom-up; cioè, si basa su informazioni a livello di impianto di impianti esistenti con le loro caratteristiche di produzione, le migliori tecnologie disponibili e innovative. L'analisi comprende 26 composti chimici di base che coprono il 75% del consumo totale di energia (compresa l'energia utilizzata come materia prima) e più del 90% delle emissioni di gas serra del settore chimico nel 2013.
L'approccio bottom-up comprende un'analisi annuale economicità della diffusione delle migliori tecnologie disponibili e innovative in ogni impianto fino al 2050, le proiezioni e le ipotesi utilizzate sono conformi allo scenario di riferimento della Commissione europea.
In termini assoluti, dai 2013-2050 consumo totale di energia aumenta del 39,2% e diminuire le emissioni di gas serra del 14,7%; questi valori includono come effetto (e dipendono) un aumento della domanda del 45,6%. Nel 2050, senza alcun miglioramento tecnologico, il'emissioni di gas serra e il consumo di energia sarebbero ripsettivam,ente superiori al 36% eed al 4%.
L'effetto minore di miglioramenti tecnologici sul risparmio energetico può essere parzialmente spiegato dal fatto che il 73,5% dell'energia totale consumata nella fabbricazione dei prodotti trattati in questo studio è incorporato nei prodotti finali, e la maggior parte delle nuove tecnologie hanno un impatto sull'uso diretto di energia.
Indice dello studiio:
Executive summary
1 Introduction
2 Overview of the European chemical and petrochemical sector
2.1 Background of the EU chemical and petrochemical industry in the EU-28
2.2 Energy consumption and GHG emissions of the EU chemical and petrochemical industry
3 Policy context
4 Methodology and current status of the EU chemical and petrochemical industry
4.1 Definition of boundaries
4.2 Data sources for current technologies
4.3 Energy consumption and GHG emissions
4.4 Best available techniques (BATs) and Innovative Technologies (ITs)
4.5 Cross-cutting BATs and ITs
4.5.1 Combined Heat and Power (CHP)
4.5.1.1 CHP in the European chemical and petrochemical industry
4.5.1.2 Cogeneration as Best available technique
4.5.2 Carbon capture and storage as Innovative technology
4.6 Current status of the EU chemical and petrochemical industry
4.6.1 Technologies used and Production in 2013 .
4.6.2 Energy consumption and GHG emissions in 2013
5 European chemical and petrochemical industry per product
5.1 Nitric acid
5.1.1 Production processes
5.1.2 Current consumption and emission levels
5.1.3 Best available techniques (BATs)
5.1.4 Innovative technologies (ITs)
5.2 Ammonia and Urea
5.2.1 Production processes
5.2.2 Current consumption and emission levels
5.2.3 Best available techniques (BATs)
5.2.4 Innovative technologies (ITs)
5.3 Steam cracking and Acrylonitrile
5.3.1 Production processes
5.3.2 Current consumption and emission levels
5.3.3 Best available techniques (BATs)
5.3.4 Innovative technologies (ITs)
5.4 Hydrogen, Syngas and Methanol
5.4.1 Production processes
5.4.2 Current consumption and emission levels
5.4.3 Best available techniques (BATs)
5.4.4 Innovative technologies (ITs)
5.5 Adipic acid
5.5.1 Production processes .
5.5.2 Current consumption and emission levels
5.5.3 Best available techniques (BATs)
5.5.4 Innovative technologies (ITs)
5.6 Soda ash
5.6.1 Production processes
5.6.2 Current consumption and emission levels
5.6.3 Best available techniques (BATs)
5.6.4 Innovative technologies (ITs)
5.7 Aromatics
5.7.1 Production processes
5.7.2 Current consumption and emission levels
5.7.3 Best available techniques (BATs)
5.7.4 Innovative technologies (ITs)
5.8 Carbon black
5.8.1 Production processes
5.8.2 Current consumption and emission levels
5.8.4 Innovative technologies (ITs)
5.9 Chlor-alkali
5.9.1 Production processes
5.9.2 Current consumption and emission levels
5.9.3 Best available techniques (BATs)
5.9.4 Innovative technologies (ITs)
5.10 Ethylene oxide and Ethylene glycol
5.10.1 Production processes
5.10.2 Current consumption and emission levels
5.10.3 Best available techniques (BATs)
5.10.4 Innovative technologies (ITs)
5.11 Ethylene dichloride and Vinyl chloride monomer
5.11.1 Production processes
5.11.2 Current consumption and emission levels .
5.11.3 Best available techniques (BATs)
5.11.4 Innovative technologies (ITs)
5.12 PVC
5.12.1 Production processes
5.12.2 Current consumption and emission levels
5.12.3 Best available techniques (BATs)
5.12.4 Innovative technologies (ITs)
5.13 PVC recycling
5.13.1 Production processes
5.13.2 Current consumption and emission levels
5.13.3 Best available techniques (BATs)
5.13.4 Innovative technologies (ITs)
5.14 Ethylbenzene and Styrene .
5.14.1 Production processes
5.14.2 Current consumption and emission levels
5.14.3 Best available techniques (BATs)
5.14.4 Innovative technologies (ITs)
6 Model
6.1 Basic input in the model
6.2 Step 1: Calculation of operating costs
6.3 Step 2: Production vs expected demand
6.4 Step 3: Cost-effectiveness analysis for integrating BATs and ITs
7 Input scenarios
8 Results
8.1 Total energy consumption and GHG emissions trends
8.2 Results per product
8.2.1 Nitric acid
8.2.2 Ammonia and Urea
8.2.3 Steam cracking
8.2.4 Hydrogen and Methano
8.2.5 Adipic acid
8.2.6 Soda ash
8.2.7 Aromatics
8.2.8 Carbon black
8.2.9 Ethylene oxide and Monoethylene glycol
8.2.10 Ethylene dichloride and Vinyl chloride monomer
8.2.11 PVC
8.2.12 Ethylbenzene and Styrene
8.2.13 Chlor-alkali
9 Conclusions
References .
List of figures
List of tables
Annex 1: Abbreviations
Annex 2: Basic chemical product chains
Ammonia
Ethylene
Propylene
Methanol
Benzene
Toluene
Xylene
Chlor-alkali
Annex 3: Calculation of national energy mixes
EU Maggio 2017

ID 21782 | 30.04.2024
Direttiva (UE) 2024/1203 del Parlamento europeo e del Consiglio, dell’11 aprile 2024, sulla tutela penale dell’ambien...
ID 23742 | 23742 / In allegato
Documento per la consultazione 147/2025/R/RIF
Il documento illustra - a partire da...

MATTM 10 Maggio 2018
Sviluppare una Strategia nazionale del verde urbano che fissi criteri e linee guida per la promozione di foreste urbane e periurbane coerenti co...
Testata editoriale iscritta al n. 22/2024 del registro periodici della cancelleria del Tribunale di Perugia in data 19.11.2024