CEI EN IEC 62881:2019 | Matrice Causa / Effetti C&E | Diagrammi di Ishikawa
| Appunti Normazione | ||
| 17 Maggio 2025 | ||
| Salve Visitatore | ||
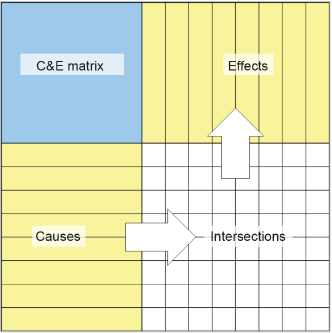
CEI EN IEC 62881:2019 - Matrice Causa / Effetti C&E E’ Stata pubblicata da IEC e dal CEN la prima Edizione della norma EN IEC 62881:2018 Matrice Cause ed effetto ed è stata recepita dal CEI a Marzo 2019 come CEI EN IEC 62881:2019. La norma descrive è un metodo semplice e ampiamente accettato per documentare gli interblocchi logici nelle industrie di processo e manifatturiere - la "matrice causa ed effetto" (matrice C&E). Excursus 1 Scope This document addresses the setting and implementation of C&E matrices for a consistent use in engineering activities. It aims to describe a simple format used to support a consistent exchange of information between different engineering disciplines involved in project or maintenance activities. The transfer of the relations defined in C&E matrices into a functional or source code for the application programming of PLC/DCS is out of the scope of this document. In addition, this document does not cover the implementation of complex and/or sequential logics at a dedicated automation platform, which will require additional stipulations to be done/ followed. It is understood, that C&E matrices in fact can be used to document the fault reactions of the plant equipment and therefore can be used as reference point for the necessary safety verifications to be applied. C&E matrices as defined in this document do not have the same scope as Fishbone or Ishikawa diagrams, which are often named in the literature as cause and effect diagrams. For the design of C&E matrices the following layout principles shall be applied: - causes shall be listed in the lines; Figure 1 - C&E matrix
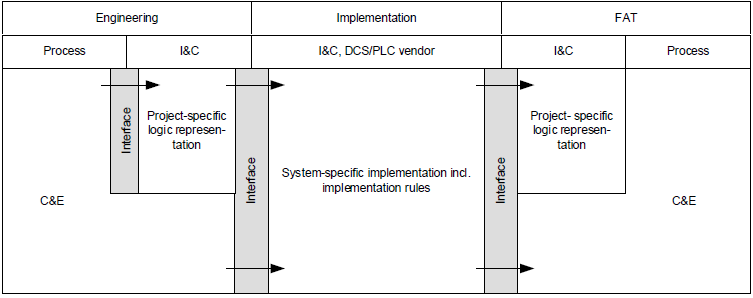
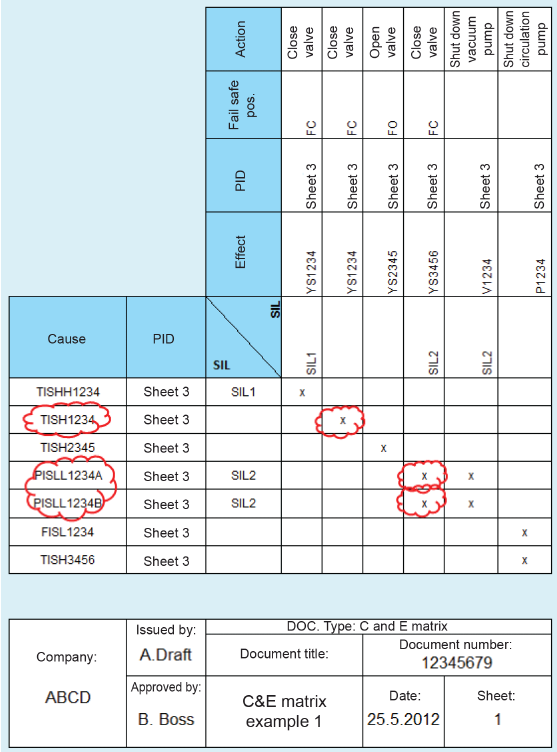
Mandatory attributes are (see Figure 3): - identifier as per the designated reference scheme for example IEC 81346-1 including an activation condition; EXAMPLE Temperature sensor which triggers an action at a certain temperature, for example: TICSLL1234, T1234/TICS++ etc.. - at least one referenced document (e.g. P&ID); Optional attributes may be, for example (see Figure 5): - description (e.g. service text, remarks, notes); Detailed stipulations may be subject to individual conventions (e.g. company standard) to be agreed upon and documented in the C&E matrix legend. 5.3 Attributes of effects Mandatory attributes are: - effect identifier: tag name according to IEC 81346-1 (e.g. valve – tag name Y1234); Optional attributes may be, for example (see Figure 5): - description (e.g. service text, remarks, notes); Detailed stipulations may be subject to individual conventions (e.g. company standard) to be agreed upon and documented in the C&E matrix legend. 5.4 Attributes of relations There are two different alternatives for the relations. Alternative 1 (see Figure 3): - " " (empty): no relation; In this case a verbal description of the triggered action is required on the effect side, for example “close valve”, “switch pump motor off”. Alternative 2 (see Figure 4): The use of “X” can be replaced by a simple description of the triggered action. Those descriptions may be, for example: - "CL": Close; Figure 2 - Project workflow 7 Examples 7.1 C&E matrix with minimum requirement for cause and effect, and alternative 1 for Relations
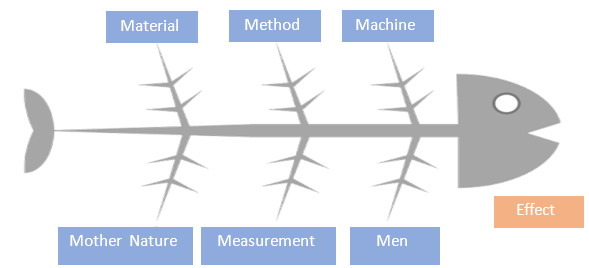
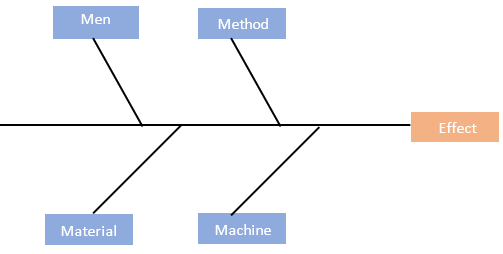
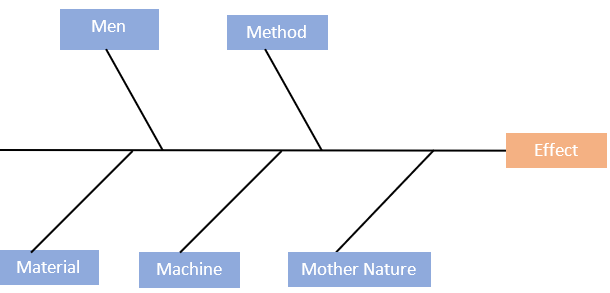
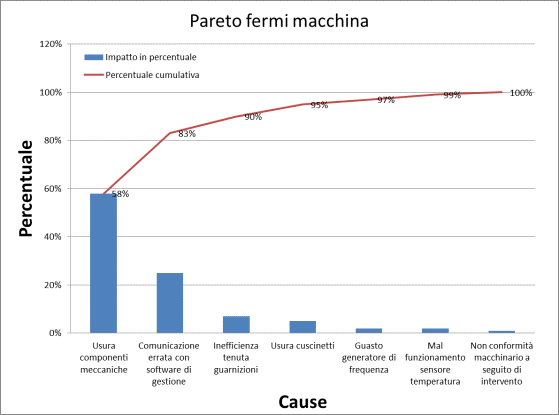
Matrici EN IEC 62881 e Diagramma di Ishikawa Questo tipo di diagrammi causa-effetto sono stati messi a punto in Giappone nel 1943 da Kaoru Ishikawa, guru della qualità totale. Il diagramma di Ishikawa, detto anche diagramma a spina di pesce (fishbone) o diagramma causa-effetto, serve a cercare le cause che hanno prodotto un certo effetto. Fig. 8 Diagramma di Ishikawa a 5M (1) La struttura del diagramma è di tipo gerarchico, ad albero orizzontale. Nella testa del pesce si colloca il difetto, il problema, l’evento critico, l’incidente. Lungo le spine del pesce si collocano le cause che lo hanno provocato, o potrebbero averlo fatto. Perché il diagramma ha la forma della spina di pesce? Perché la testa invita a prendere in considerazione un solo problema per volta, le spine spingono a non accontentarsi di una sola causa, ma a cercarne altre, e a risalire alle cause delle cause. Le quattro M sono solo indicazioni di massima. Ovviamente ognuno può partire con le categorie più inerenti al suo caso. Un altro strumento particolarmente efficace per avviare questo tipo di studio sono le mappe mentali, che danno un supporto in chiave grafica e permettono di annotare gli spunti che emergono durante le sessioni di brainstorming. Il diagramma di Ishikawa, detto anche diagramma a spina di pesce (fishbone) o diagramma causa-effetto, serve a cercare le cause che hanno prodotto un certo effetto. Fig. 9 Diagramma di Ishikawa, versione 4M. Il 5M Nel 5M, come detto, è aggiunta una quinta causa: l'ambiente (Mother Naturee), per cui si parla di "5M". Fig. 11 - Diagramma di Ishikawa 5M [...] Il diagramma di Pareto La spina di Ishikawa: consente di elencare e raggruppare in maniera coerente tutte le possibili non conformità che possono concorrere all’insorgere del problema. Il diagramma di Pareto è un grafico che rappresenta l'importanza delle differenze causate da un certo fenomeno. Esso contiene al suo interno un grafico a barre e un grafico a linea, dove ogni fattore è rappresentato da barre poste in ordine decrescente e la linea rappresenta invece una distribuzione cumulativa (detta curva di Lorenz). Questo tipo di grafico può aiutare a stabilire quali sono i maggiori fattori che hanno influenza su un dato fenomeno, ed è quindi un utile strumento nelle analisi, nei processi decisionali, nella gestione della qualità ed in numerosi altri settori.
Certifico Srl - IT | Rev. 2019 Fonte: |
||
|
|
||
 |
||
| www.certifico.com
è un sito di INVIO NEWSLETTTER Se vuoi cancellarti dall'invio della newsletter oppure effettua il login al sito ed entra nella Tua Area Riservata, in “Modifica dati” agisci con la spunta sul box di selezione “Newsletter”. L'Elenco completo di tutte le ns newsletter è qui: Archivio newsletter. |
||
  |
||
| Certifico Srl 2000-2020 | VAT IT02442650541 | ||


